Blog
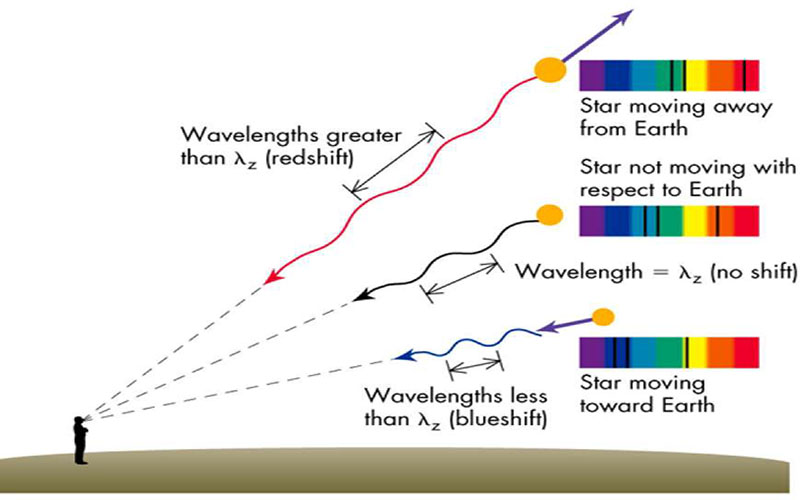
Radial Velocity
A measure of movement towards or away from the observer, radial velocity is just one component of stellar motion that is derived through measurement of the doppler effect.
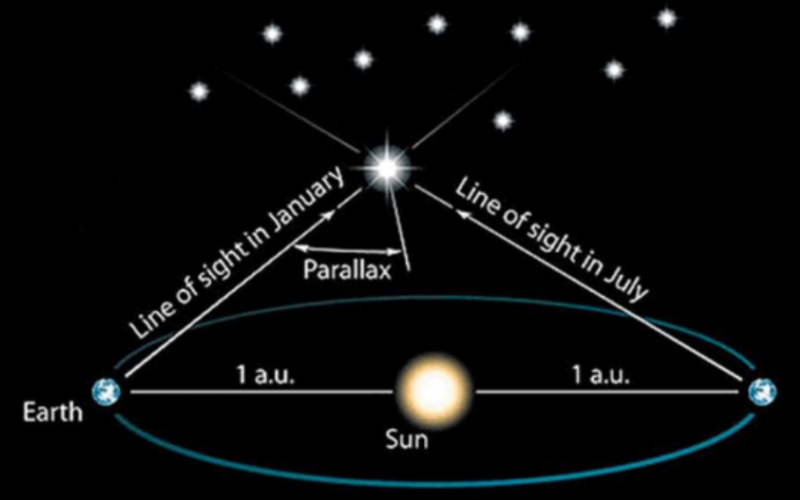
Astrometry Overview
Astrometry is the area that deals with the positions and motions of celestial objects. It has two main scientific...
Telescopes: An Overview
Telescopes gather light from objects, and there are two main types: refractor (uses a lens to bend light) and reflector (uses a mirror to reflect light). Aperture and field of view are two main parameters of telescopes.
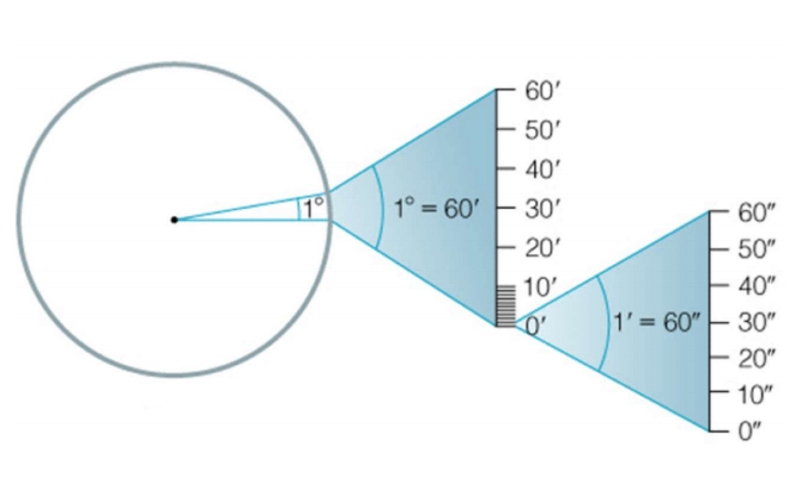
Angular Measurements of the Sky
When describing night-sky objects, spherical (not linear) measurements are used. These measurements are typically in degrees, arcminutes, and arcseconds.
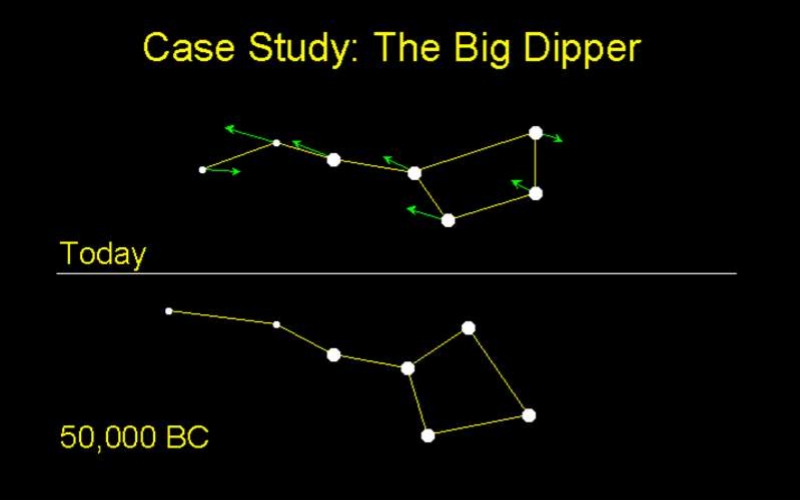
Proper Motion
Proper motion is the change in (x, y) tangential motion of a star, and described in two coordinates: Right Ascension and Declination

Color and Temperature
Star color is based on its temperature (hotter stars are blue, while cooler stars are red), and the color/temperature of a star can be classified into stellar classes
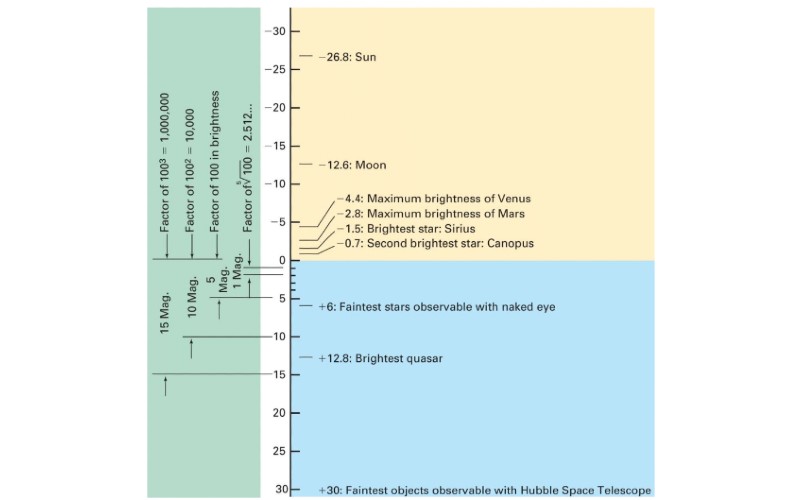
Magnitudes: Absolute and Apparent
Magnitude is the brightness of a star, and the measures of magnitude are absolute (brightness as appears to observer) and apparent (measure of how much light is being put out by an object)
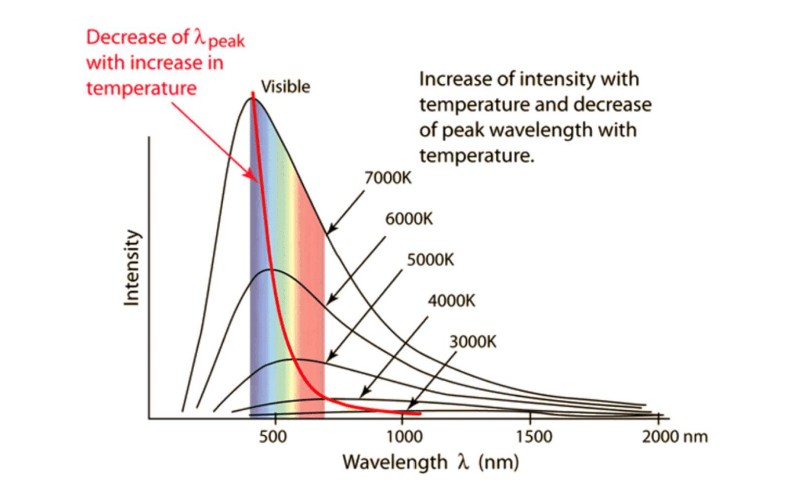
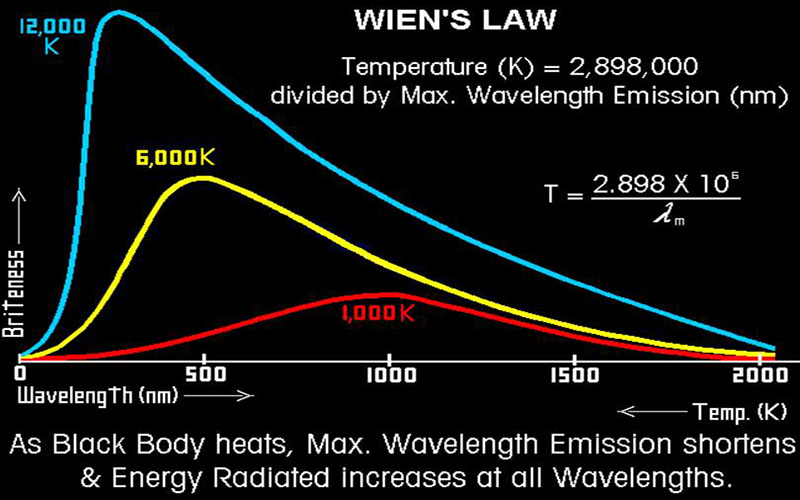
Wien’s Law
Wein's Law relates light intensity to temperature, stating that the peak wavelength is the inverse of temperature, and temperature and intensity are directly correlated.
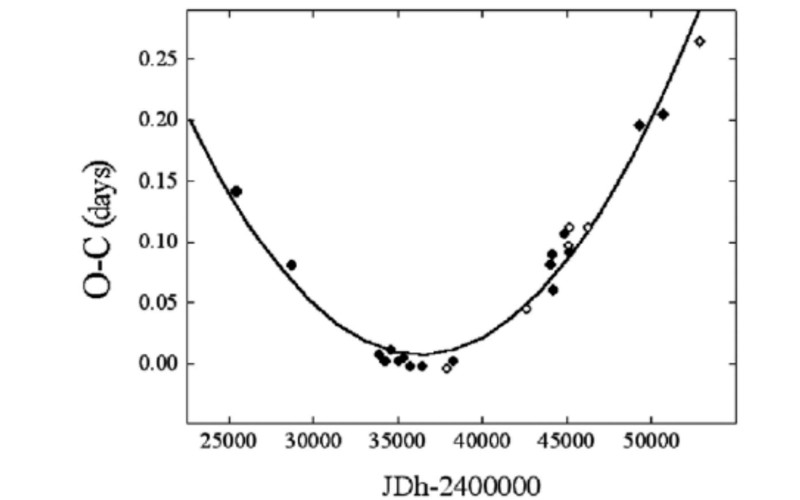
Light Curve O-C Diagrams
The O-C, or Observed-Computed method studies period changes in variable stars by comparing the observed time of maximum brightness to the computed time. The O-C method is reflective of the cumulative effect of period changes.
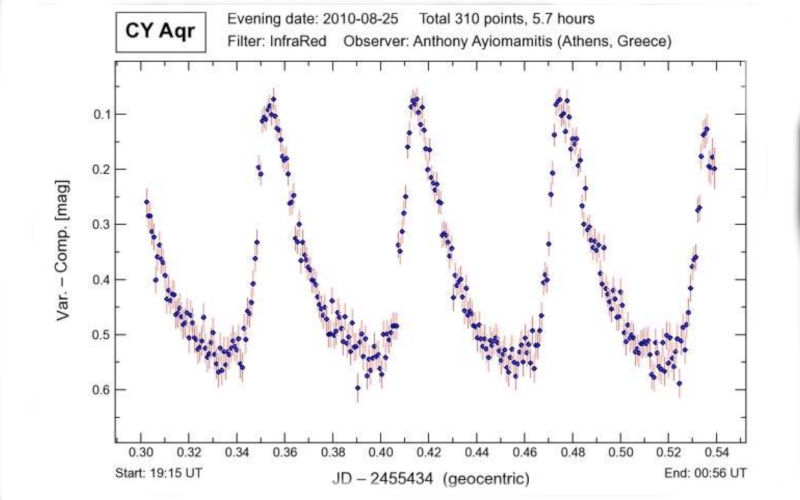
Overview of a Light Curve
Light curves are graphs plotting the light output of an object over time, and are developed by taking images of an area repeatedly, using software to measure brightness over time, and graphing the points.
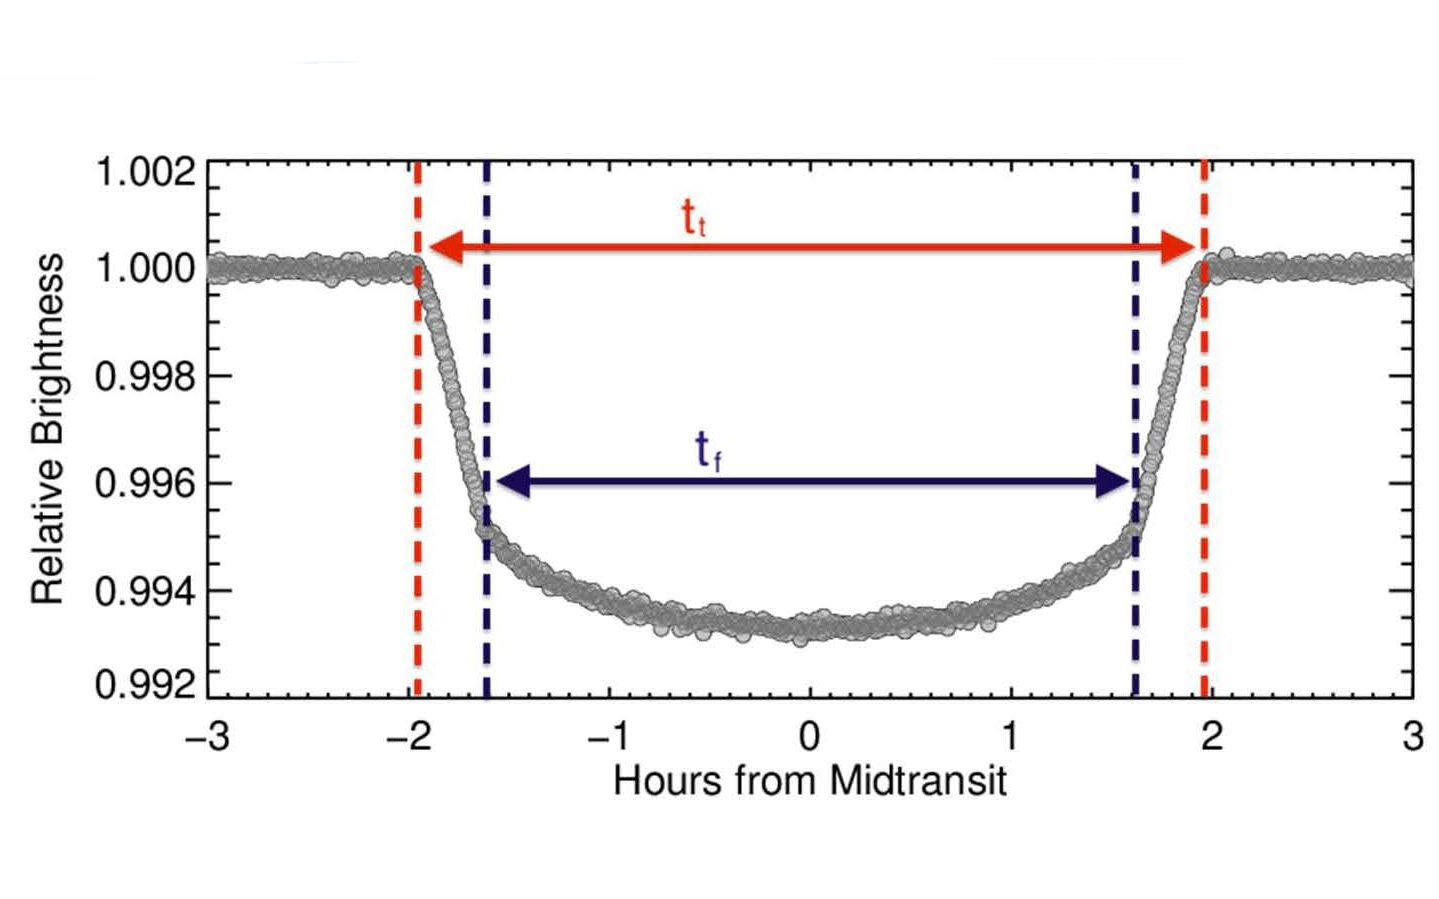
Light Curve Analysis
Light curves are a collection of magnitude observations over time, and time-series analysis can be used to understand physical characteristics of the observed system
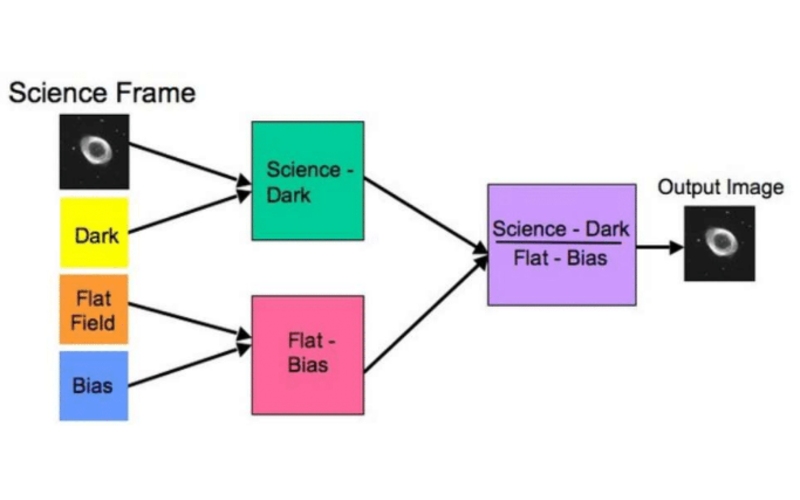
Image Reduction – Overview
Image processing goes through pre-processing (calibrating images using darks, biases, and flat-fields) and post-processing (When images are digitally reduced: WCS Coordinates, removal of Cosmic Rays, Transformed, etc)
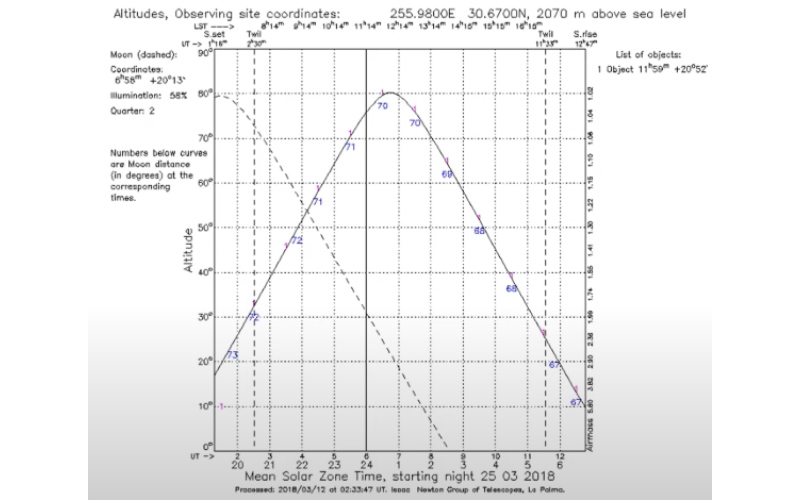
Visibility Curve For Your Target and How To Use It
When imaging your star, make sure your declination can be imaged by your observatory.
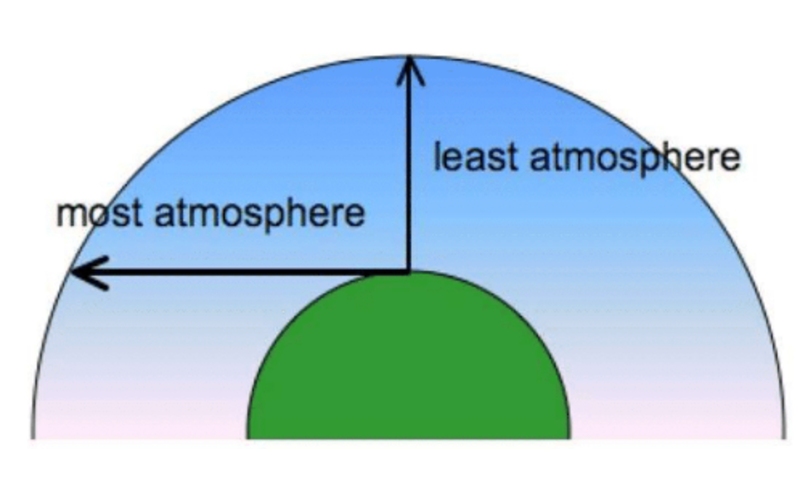
Airmass
Airmass is the path length for light from an astronomical object to pass through the Earth’s Atmosphere, and a greater airmass means dimmer targets
Planning your Image – Moving Object
Make sure your target location and visibility are good, accounting for movement; and make sure your comp star is in range.
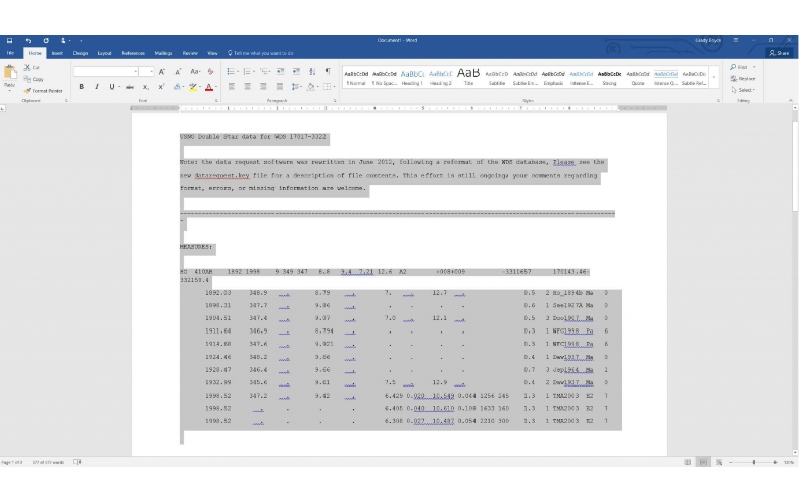
How to Format Data from the USNO
This video goes over key points to the email from the USNO, saving the attachments, the historical data raw file, and editing and formatting in Word.
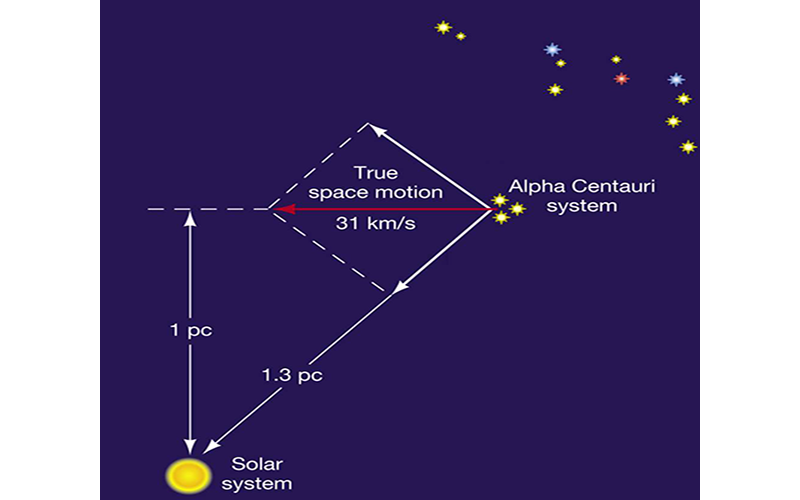
Stellar Motions
Stellar motions divide star movement into three categories: radial motion, proper motion, and a combination of the two (space motion).
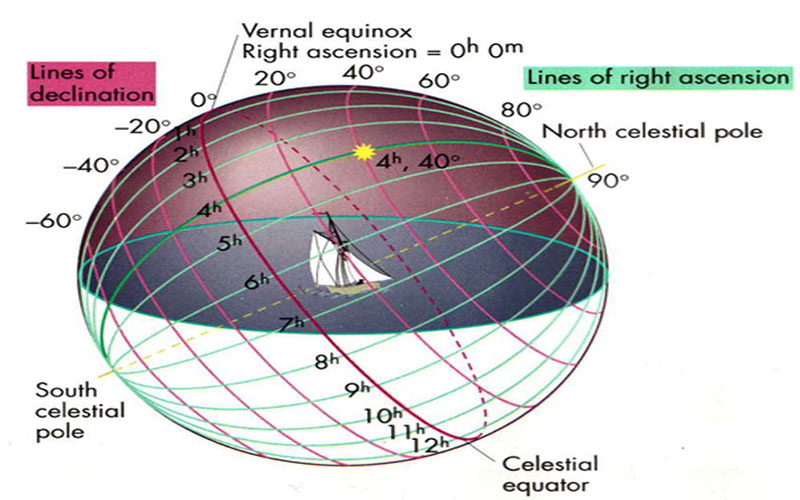
Celestial Coordinates
Similar to latitude and longitude, Right Ascension and Declination define the celestial coordinate system used to locate and place celestial objects.
Magnitudes, Luminosities, and Imaging Close Double Stars
In cases where imaging is made difficult by bright, closely spaced double stars, filters combined with the stars' stellar type can be used to create visual separation through the manipulation of their light distribution.