Category:

Light Curves
Light Curves

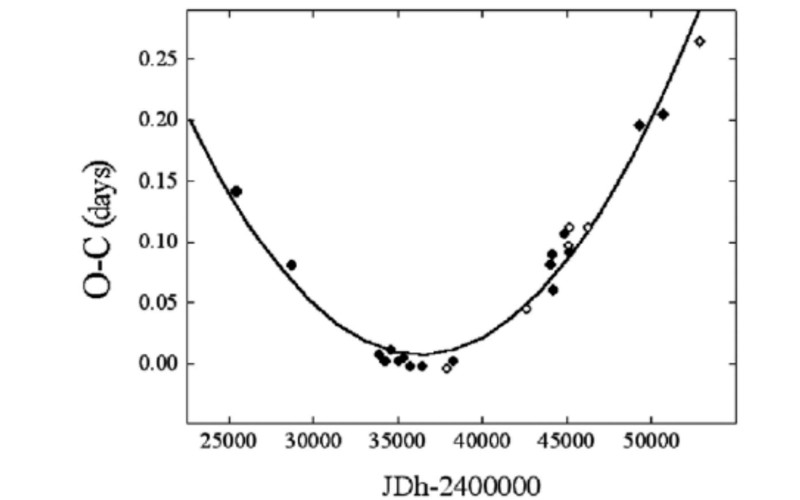
Light Curve O-C Diagrams

The O-C, or Observed-Computed method studies period changes in variable stars by comparing the observed time of maximum brightness to the computed time. The O-C method is reflective of the cumulative effect of period changes.

Light Curves

Overview of a Light Curve

Light curves are graphs plotting the light output of an object over time, and are developed by taking images of an area repeatedly, using software to measure brightness over time, and graphing the points.

Light Curves

Light Curve Analysis

Light curves are a collection of magnitude observations over time, and time-series analysis can be used to understand physical characteristics of the observed system

Light Curves

Phase Diagram

By folding light curve data, phase plots provide a way to construct and analyze a variable star's light curve using multiple measurements.