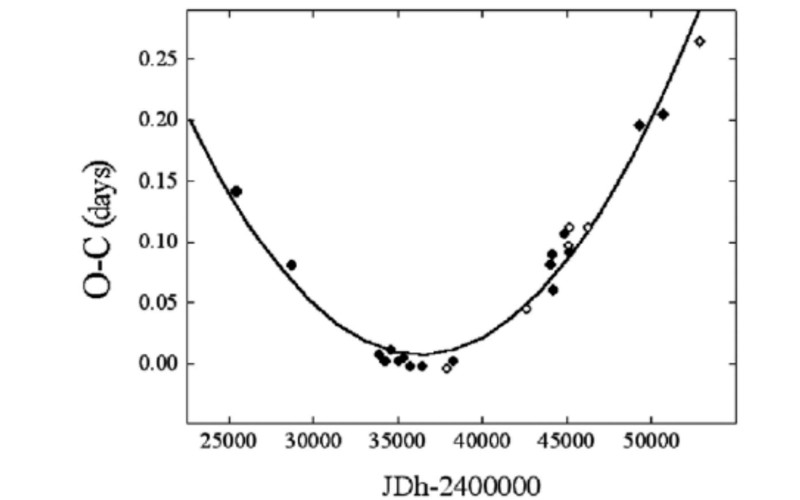
The O–C (Observed – Computed) method is the classical method for studying period changes in variable stars, because it is sensitive to the cumulative effect of the period changes.
O-C diagrams compare the observed time of maximum brightness O with the calculated time C, assuming a known constant period P.
A perfectly periodic system repeats exactly the same behavior, over and over again. Other variables are not as reliable with each cycle a little different from every other cycle.
Not only are their periods not perfectly periodic, but these stars also sometimes “switch” from one period to another(a process known as mode switching). Their amplitudes change dramatically: they may suddenly increase their variability, or they may stop varying altogether (but when they do, they usually start up again soon after).
Many variables are not perfectly periodic despite repeating cycles over and over again. Each cycle is a little different.