
Radio Astronomy from BART
This page provides continuous radio astronomy data from BART (Boyce-Astro Radio Telescope) located in southern California.
BART is a fixed 1-meter dish that observes the 1420 MHz /21 cm neutral hydrogen spectrum. That frequency is interesting to observe because neutral hydrogen is abundant throughout the Milky Way and emits a characteristic spectral line at 1420 MHz.
By measuring the strength and Doppler shift of this line, observers can trace the distribution and motion of hydrogen gas across our Galaxy, including regions that may be difficult to study with visible light
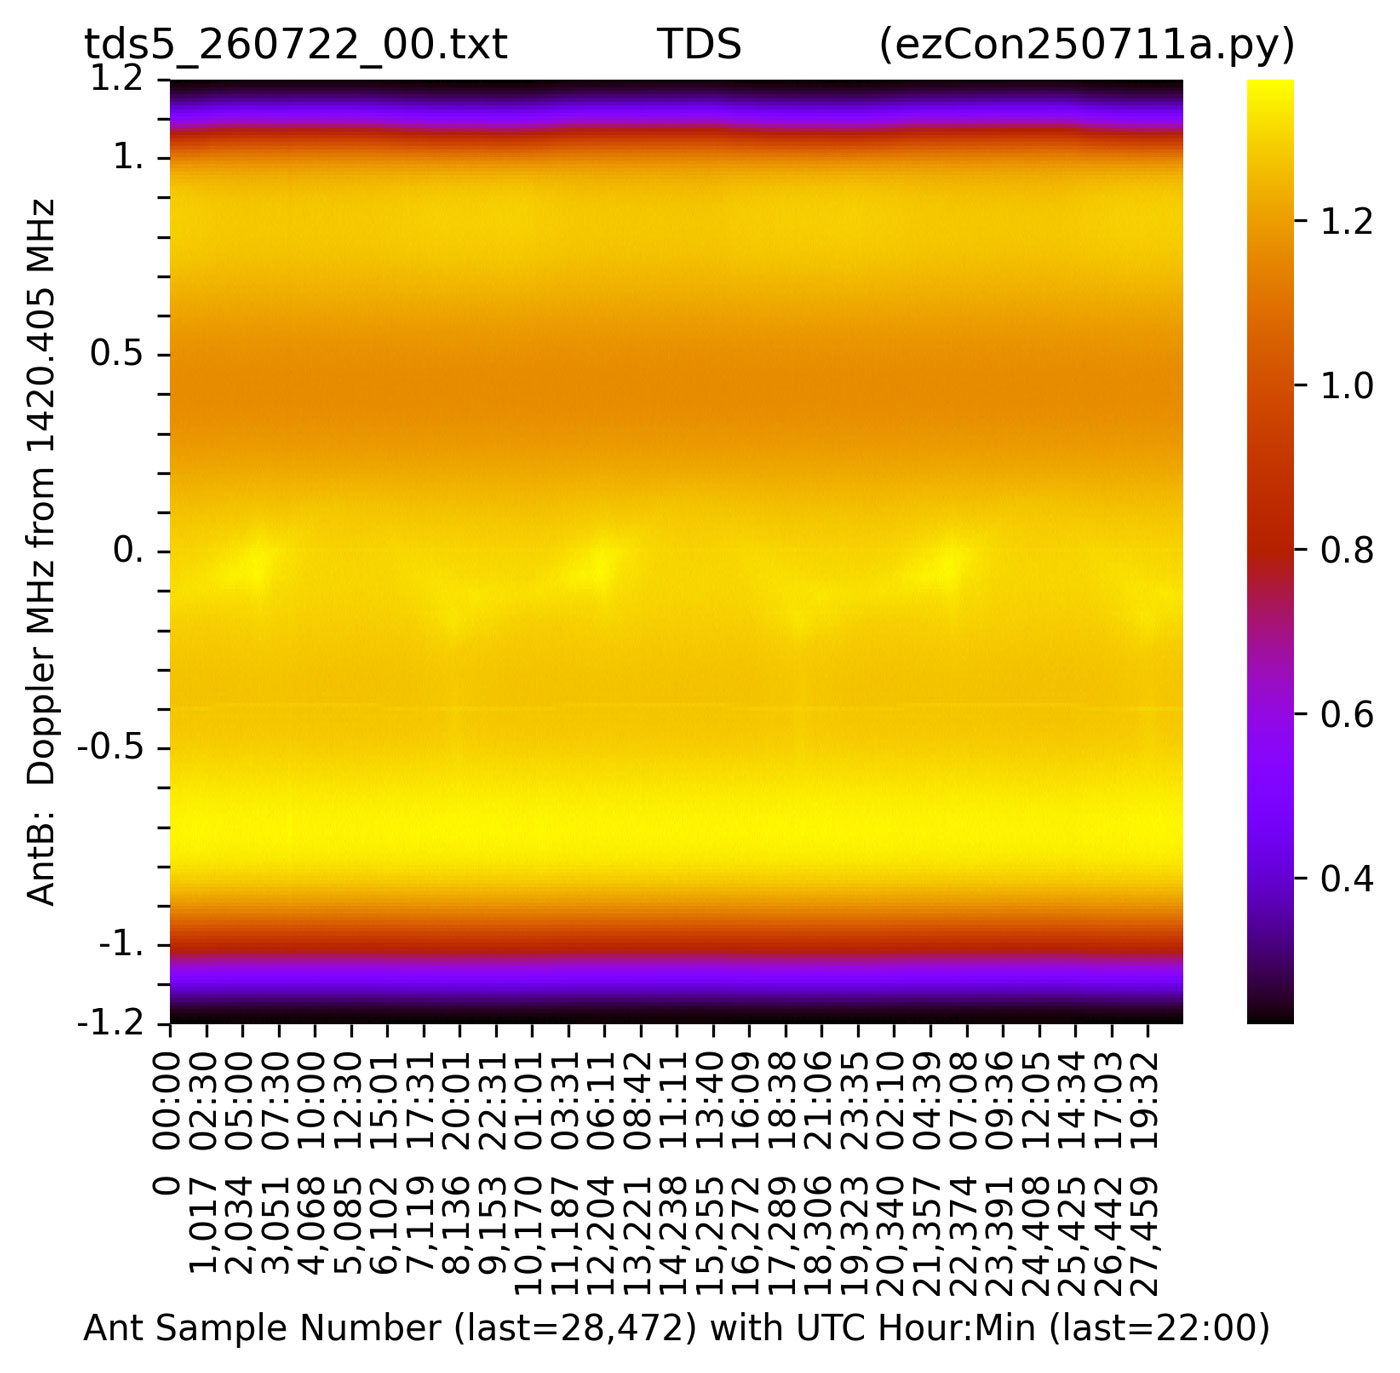
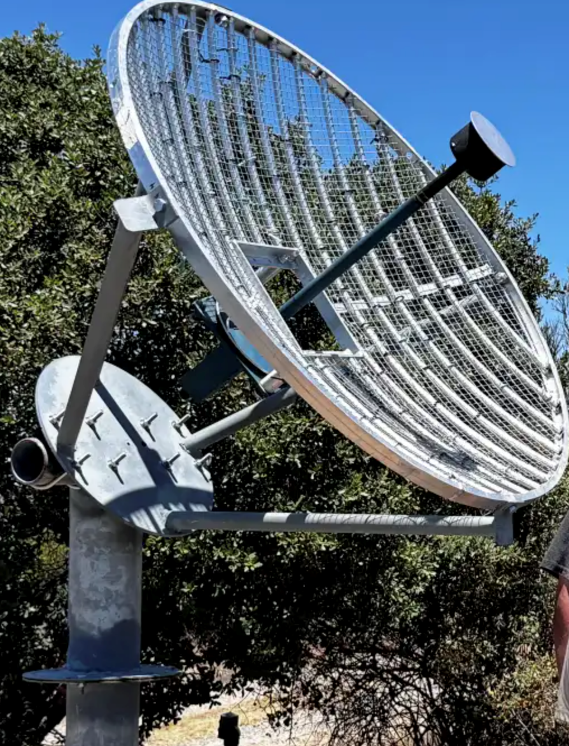
Because BART is a fixed antenna, it points to a different point in the sky as the Earth rotates. It observes day and night and continuously records the spectrum data to this website.
Over the course of each day, this drift-scan method allows BART to sample a broad strip of the sky without moving the antenna. Repeated observations make it possible to compare the strength and Doppler shift of the 1420 MHz hydrogen line at different times and sky positions, revealing large-scale structure and motion within the Milky Way.
The data is ready for your download and use.
No reservation or account is required.
What You Can Do with BART Data
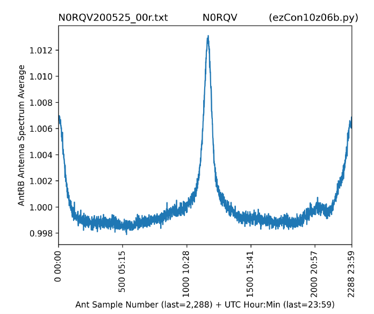
Identify a Galactic-plane crossing
Galactic-plane crossing.
As the fixed antenna scans across the sky, the 21-cm hydrogen signal becomes much stronger when the beam passes through hydrogen-rich regions of the Milky Way.
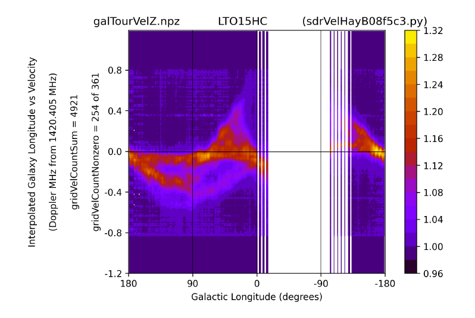
Measure hydrogen radial velocity
Hydrogen velocity.
The frequency of the 21-cm line changes because of the Doppler effect. One can convert these frequency shifts into radial velocities, showing how hydrogen gas moves toward or away from us at different Galactic longitudes.
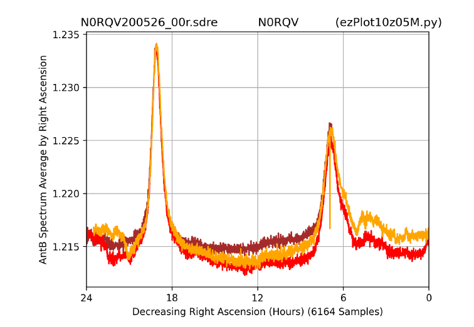
Compare different regions of the sky
Comparing the sky.
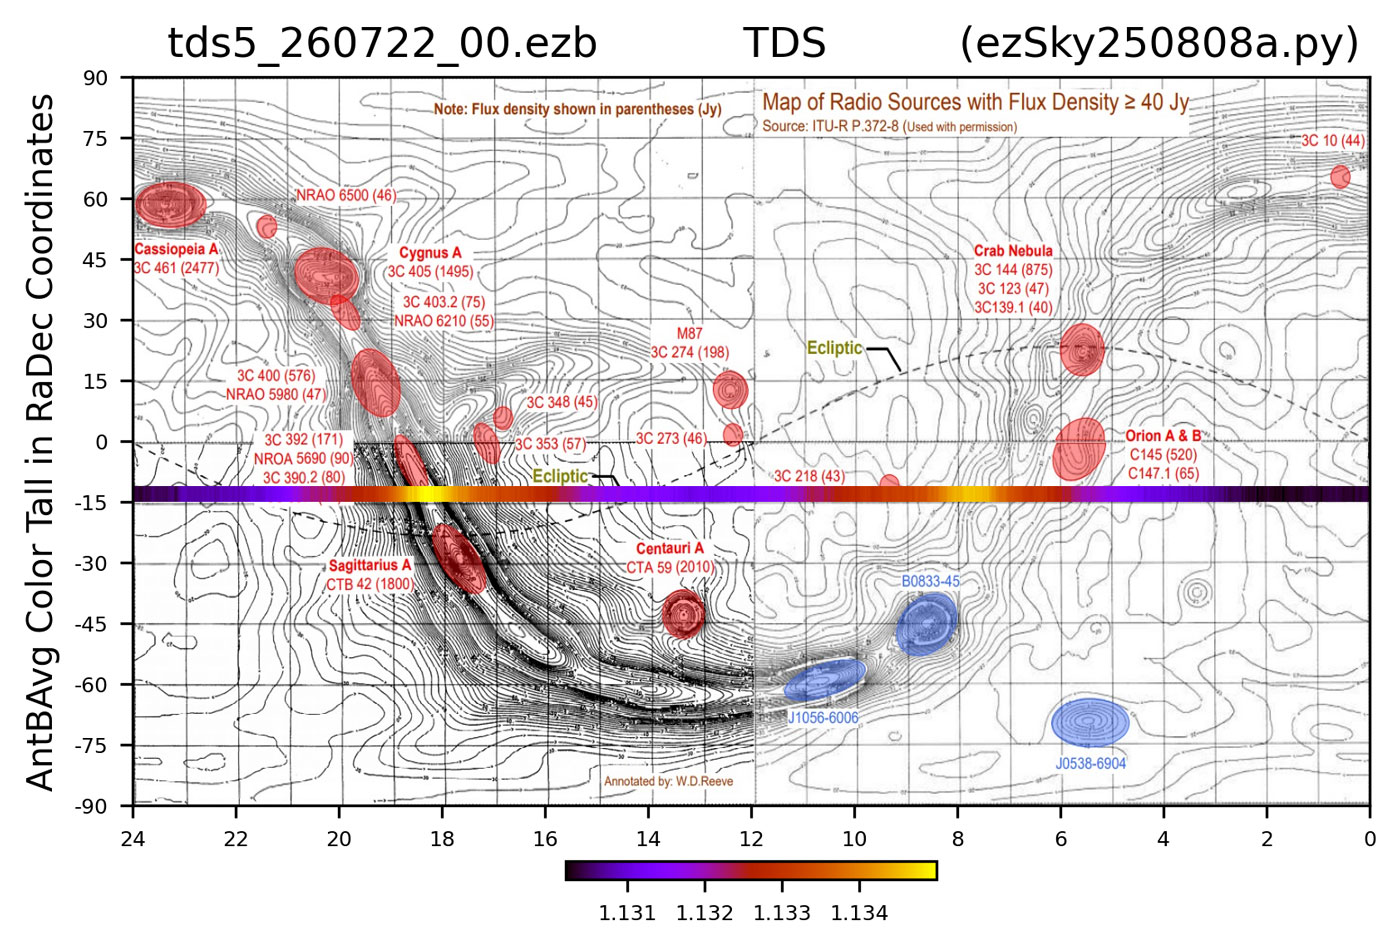
Hydrogen-line strength changes substantially with sky position. Here, repeated observations plotted against Right Ascension reveal strong emission from some regions and much weaker emission from others.
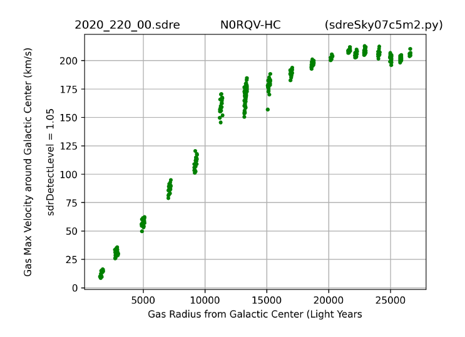
Explore the rotation of the Milky Way
Rotation of the Milky Way.
By combining hydrogen velocities measured during Galactic-plane crossings, one can estimate the rotation speed of gas at different distances from the Galactic center.
Want to learn more about radio astronomy?
Consider the BRIEF’s Intro to Radio Astronomy course
BART Data
BART continuously records the radio spectrum intensity in 10 second integrations in 256 frequency bins ranging from 1419.2 MHz to 1421.61 MHz using ezRA.
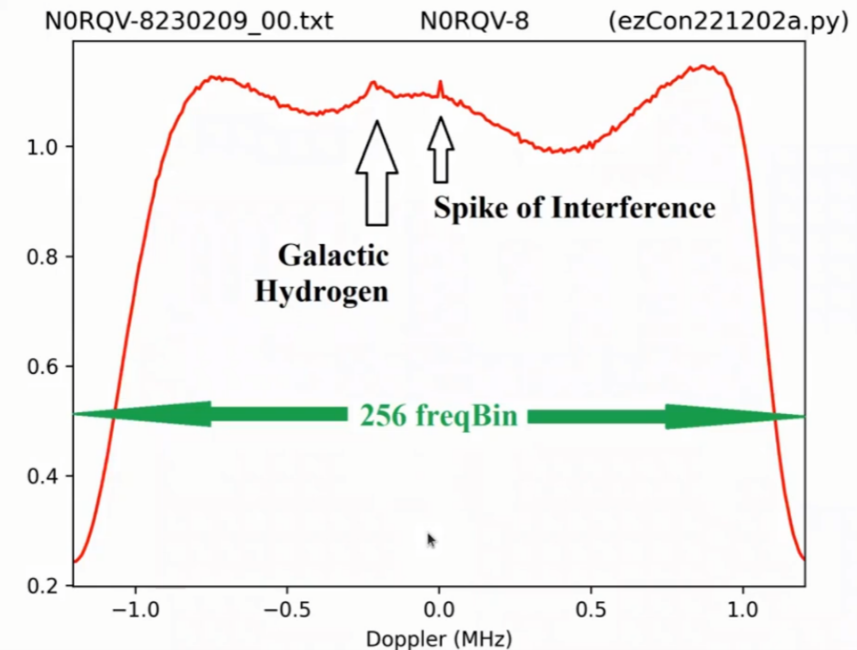
The BART ezRA files are in .csv format and easily read by spreadsheet software.
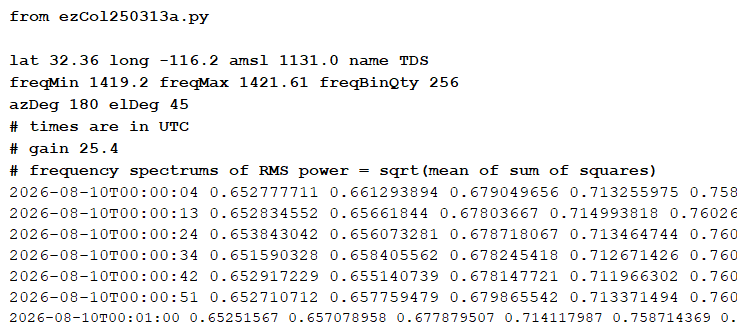
Data Analysis
Option 1:
You can use spreadsheet software, Python, or astronomy analytic software of your choice to reduce and analyze the .csv BART data files as you wish.
See a video about Spreadsheet analysis
Option 2:
You can download ezRA free to perform your analysis of the data including example shown above. ezRA is available on GitHub and you can find comprehensive documentation and many tutorials that help you getting started.
ezRA(TM) by Ted Cline
Click on the link below and download ezRA software tools to do your own signal data processing.
Want to learn more about radio astronomy?
Consider the BRIEF’s Intro to Radio Astronomy course
Download BART Data Here
Click on the folder below to access available signal data on Google Drive. Download the files and process them on your own.
About this archive
BART data are provided as an open, self-service resource. BRIEF (Boyce-Astro) does not provide individual data-reduction or software support. Users should consult the ezRA documentation or use their own analysis software.
More about BART
| Antenna | 1-meter radio dish |
| Observing frequency | 1420 MHz / 21-cm neutral-hydrogen line |
| Location | San Diego Astronomy Association Tierra Del Sol site near Boulevard, California |
| Latitude / longitude | ezRA ObsLat 32.36; ezRA ObsLon -116.2 |
| Altitude | 1131m (ezRA amsl 1131.0) |
| Azimuth | Points 170º (South) |
| Elevation | Points 40 º |
| Beam width / field of view | 30º |
| Receiver | NooElec SmartTee v2 – R820T2 |
| Polarization | horizontal |
| Operating period | Started August 2025, stabilized June 2026 |
Credits
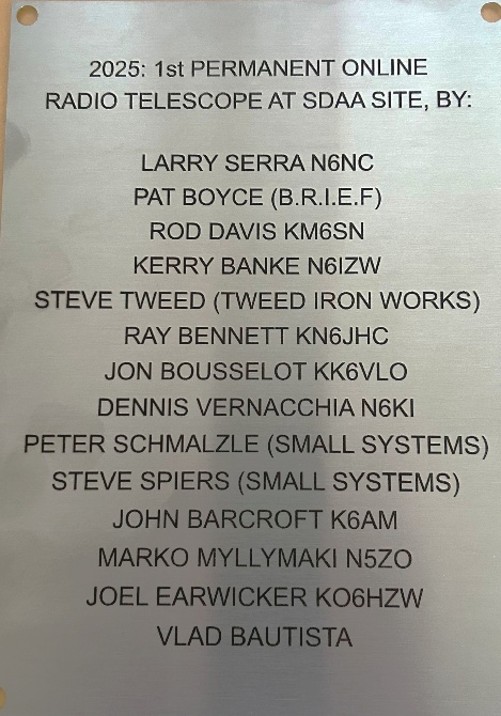
BART was designed and constructed by a team of ham radio enthusiasts led by Larry Serra. He especially thanks Steve Tweed of Tweed Ironworks who built the complicated ground and adjustable dish mount and Kerry Banke N6IZW who built and tuned the RT feedhorn from scratch. Volunteer contributions in time and money were made by many others as well in 2025 and 2026 and all are recognized on the BART plaque.
BART is located on Pad #1 at the San Diego Astronomy Association’s Tierra Del Sol (TDS) observatories. The network, computer, and data link are hosted by BRIEF (Boyce-Astro) using its BARO observatory at Pad 2 at TDS. The cloud data and this website are sustained by BRIEF.
BRIEF/ Boyce-Astro thanks all the contributors to making this project a success to enable student STEM education and citizen science research in radio astronomy.